Counter-Claim Charts
How implementers test the technical evidence behind an SEP licensing demand—before accepting the mapping or pricing the portfolio.
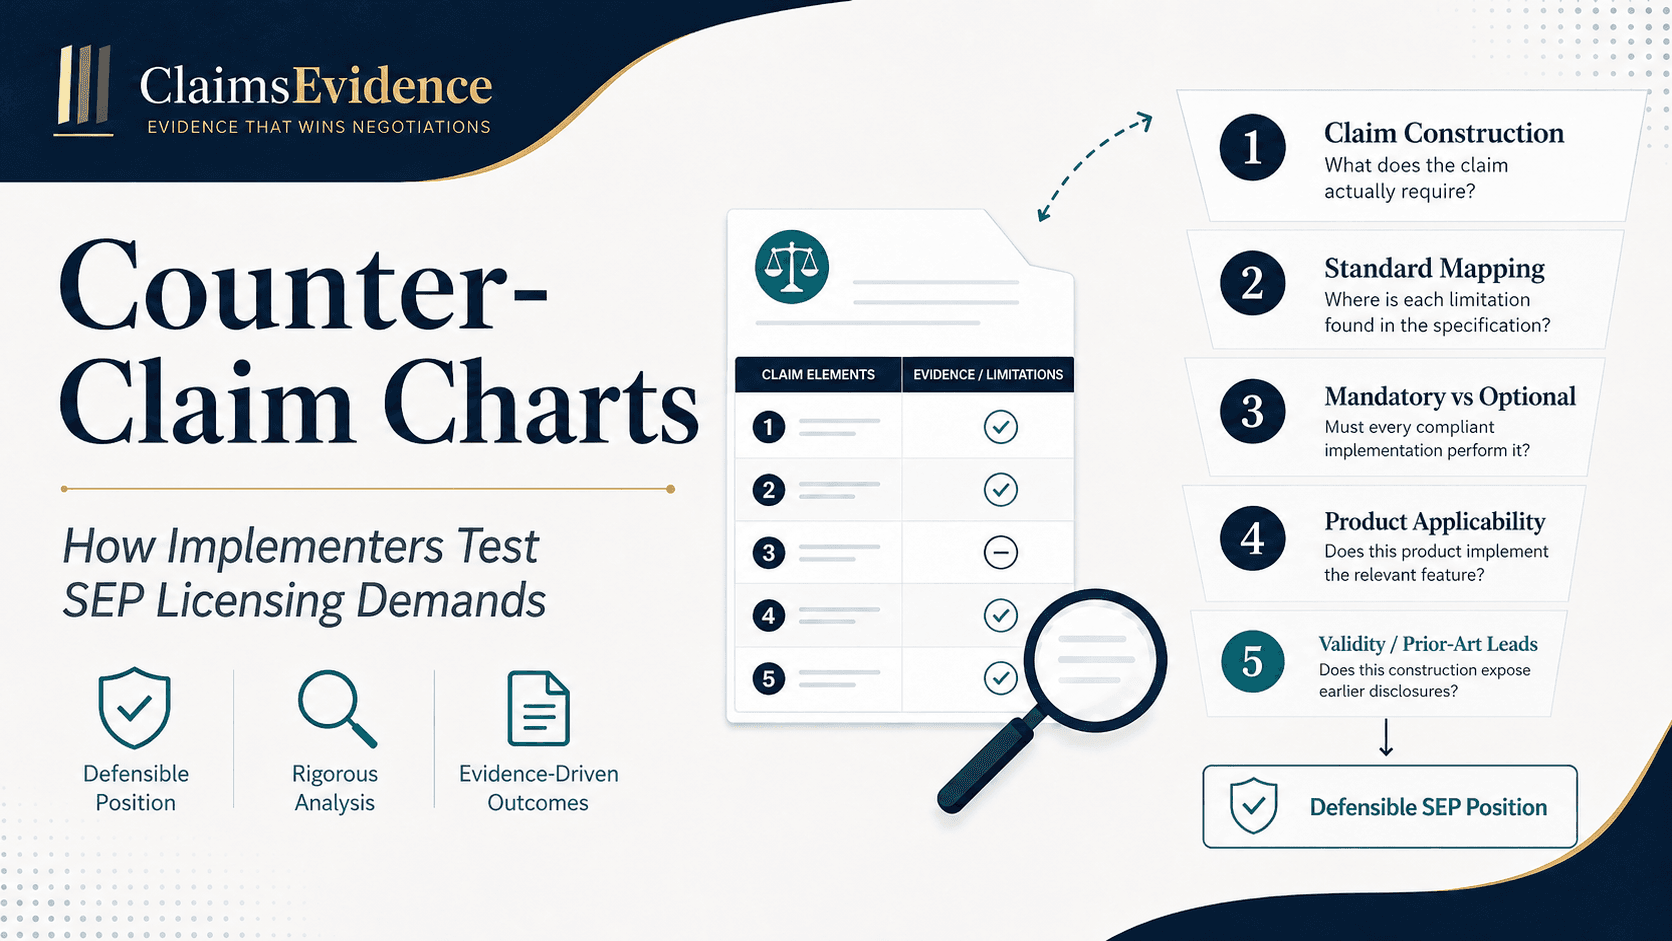
Standard-essential patent licensing has an information-asymmetry problem. A patent owner normally approaches the negotiation after selecting the patents, developing the essentiality theory and preparing claim charts. The implementer receives the finished argument—often together with a portfolio-level royalty demand.
A Counter-Claim Chartis one way to reduce that asymmetry. It does not assume the licensor's chart is right or wrong. It asks whether the evidence actually establishes each proposition the chart depends on.
What is a Counter-Claim Chart?
Counter-Claim Chart: an implementer-side, limitation-by-limitation analysis prepared in response to an asserted patent or SEP claim chart. It independently tests claim construction, the cited standard passages, mandatory versus optional behavior and product applicability, and may be supplemented by validity, prior-art, legal-status and licensing analysis.
Its central question is simple:
Does the cited evidence establish every requirement of the asserted patent claim for the relevant standard release and product?
A counter-analysis may identify, for example:
- a claim limitation missing from the cited standard passage;
- a feature that is optional, conditional or one of several permitted alternatives;
- an actor mismatch between the claim and the accused product;
- a release, profile or device-class mismatch;
- a construction broader than the patent's language and disclosure support; or
- an apparent mapping assembled from passages that need not operate together.
This is not merely a reverse claim chart. A useful Counter-Claim Chart states the licensor's proposition fairly, identifies the precise evidentiary gap, and records the technical source that supports the implementer's response.
Why SEP declarations do not end the analysis
ETSI describes its IPR database as providing information on patents declared essential or potentially essential to ETSI and 3GPP standards.[1] The current ETSI SR 000 314 also says ETSI has not investigated whether the notified patents are essential and cannot confirm their validity or relevance to a standard.[2] The database itself disclaims warranties about accuracy, applicability, relevance and essentiality.[3]
A declaration is therefore important notice and licensing information, but it is not an independent technical determination for a particular patent claim, standard release, implementation or product.
ETSI's policy definition focuses on technical necessity: an IPR is essential where a standards-compliant implementation cannot be made or operated on technical grounds without infringement.[2]That makes claim scope, normative requirements, permitted alternatives and actor attribution central to the analysis.
Economically, the distinction can be substantial. “Five hundred patents have been declared” is not equivalent to “five hundred relevant, valid and actually essential patent families are practiced by this product.” Counter-Claim Charting investigates the evidence between those statements.
What a Counter-Claim Chart looks like
The chart preserves traceability. Each claim limitation sits beside the licensor's proposed standard mapping, the implementer's counter-analysis, and a result that can be carried into negotiation, expert review or litigation preparation.
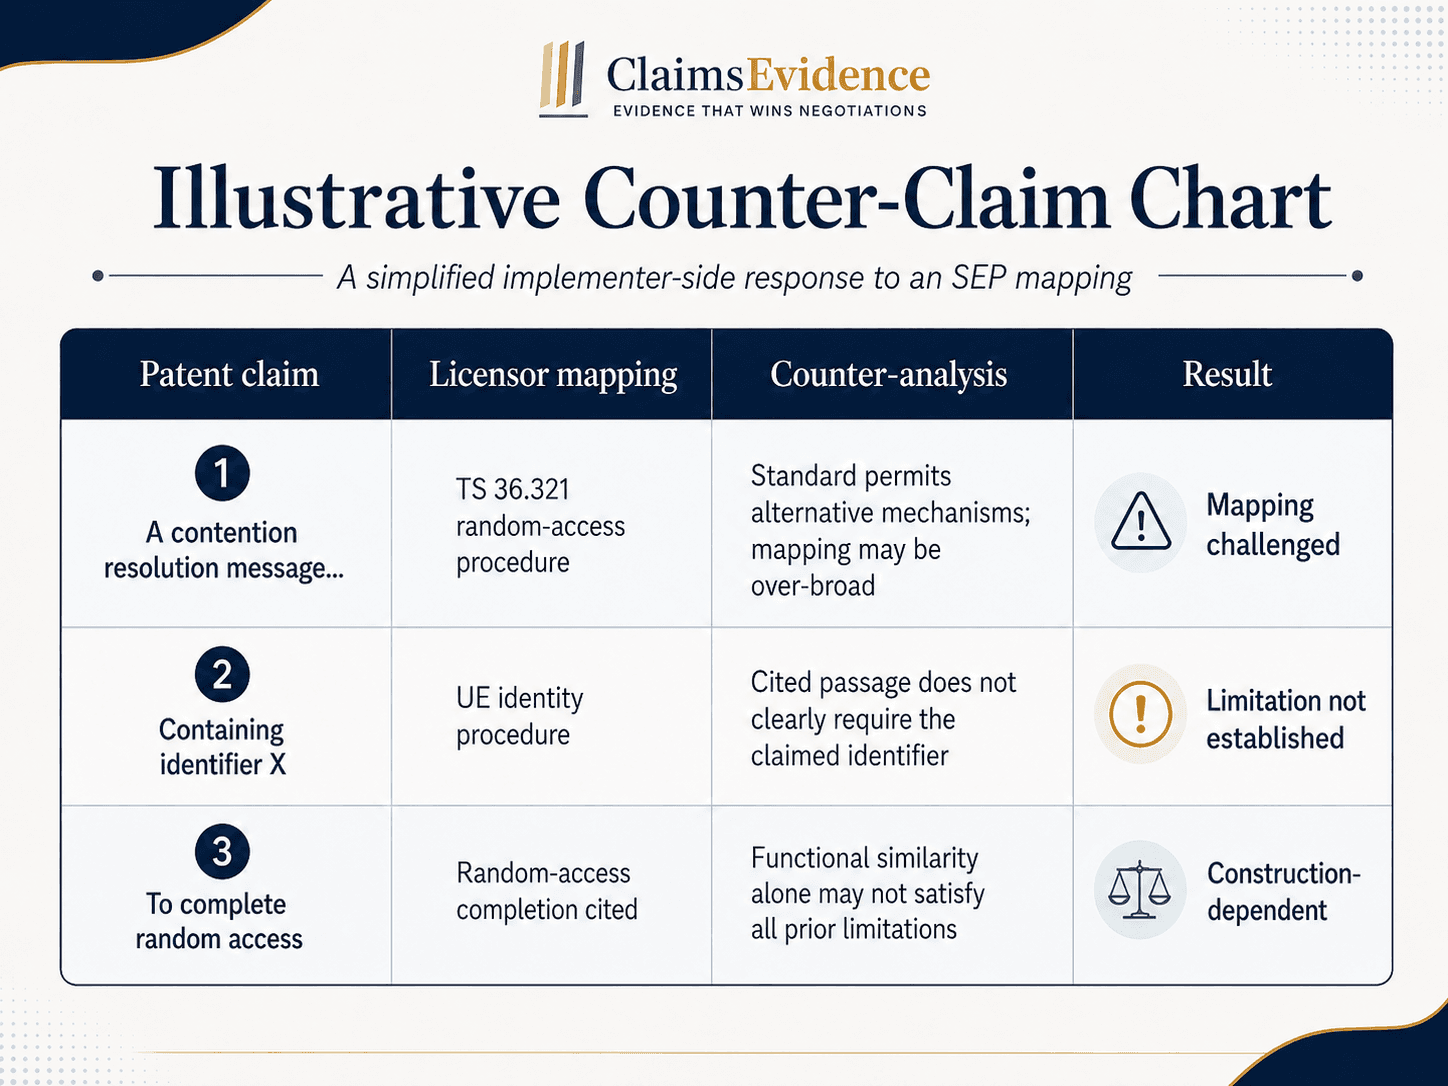
Good charts separate three outcomes that are often collapsed: the cited passage may fail to establish the limitation; the answer may depend on claim construction; or the mapped feature may be technically present but irrelevant to the accused product.
Claim construction comes first
A claim chart cannot be tested by searching a specification for similar words. Patent claims define legal scope; standards describe technical behavior. The bridge between them depends on what the asserted claim language actually requires.
Consider a simplified LTE claim phrase: “a contention resolution message … to complete the random access procedure.” A broad mapping might treat any downlink communication that resolves contention as the claimed message. A narrower reading might require a particular structure or terminal-identifying content described by the patent.
ETSI's publication of 3GPP TS 36.321 illustrates why the distinction matters. Its contention-resolution procedure includes different branches involving C-RNTI signaling and a UE Contention Resolution Identity MAC control element.[4] Finding the words “contention resolution” does not answer whether every limitation maps to each branch, whether the cited mechanism is mandatory in the relevant case, or whether the product performs the claimed acts.
A Counter-Claim Chart therefore asks, in order:
- What does the patent claim require?
- Which standardized mechanism is alleged to satisfy that requirement?
- Under what conditions, release, profile and actor does the mechanism operate?
- Does the cited evidence satisfy every limitation, not merely a similar purpose?
- What follows if the same construction is applied consistently elsewhere?
The essentiality–validity squeeze
A patent owner normally needs a construction broad enough to cover the standardized implementation. Breadth may carry a cost: the more behavior the claim covers, the more earlier technical disclosures may become relevant to novelty or inventive step.
Conversely, a narrower construction may better distinguish earlier disclosures but cease to cover the standardized feature. This creates an analytical squeeze:
Broad enough to cover the standard—but potentially broad enough to encounter prior art. Narrow enough to avoid the prior art—but potentially too narrow to remain essential.
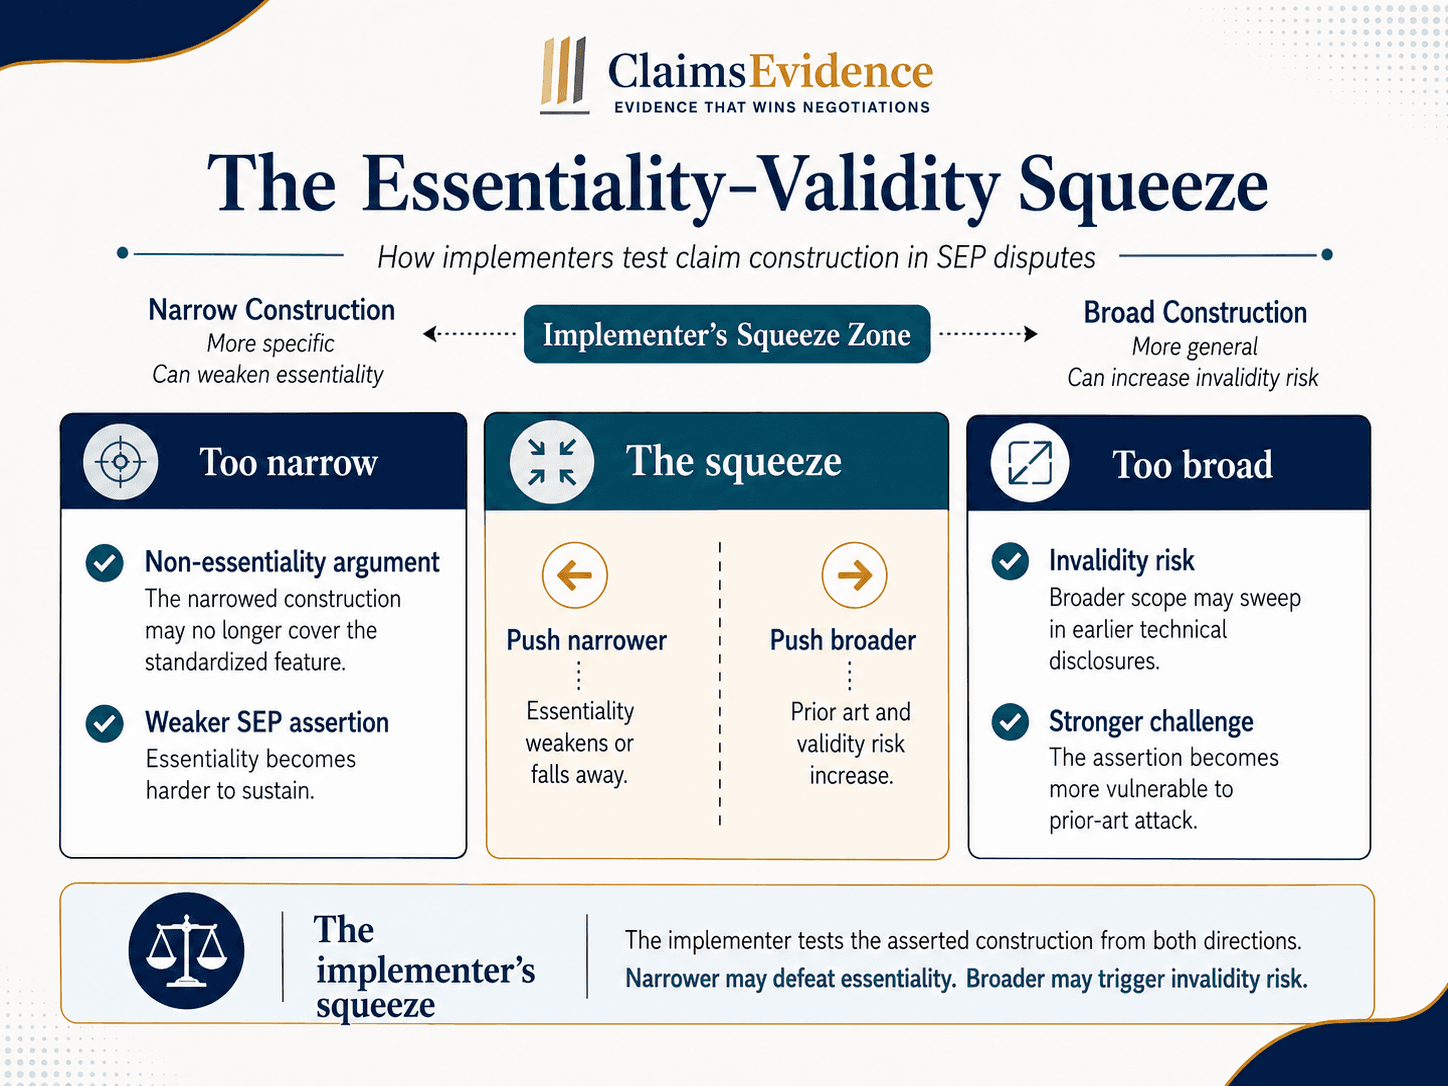
Essentiality and validity remain different questions. The point is consistency: the construction used to capture the standard should not silently change when earlier disclosures are assessed.
The Counter-Claim Chart five-gate test
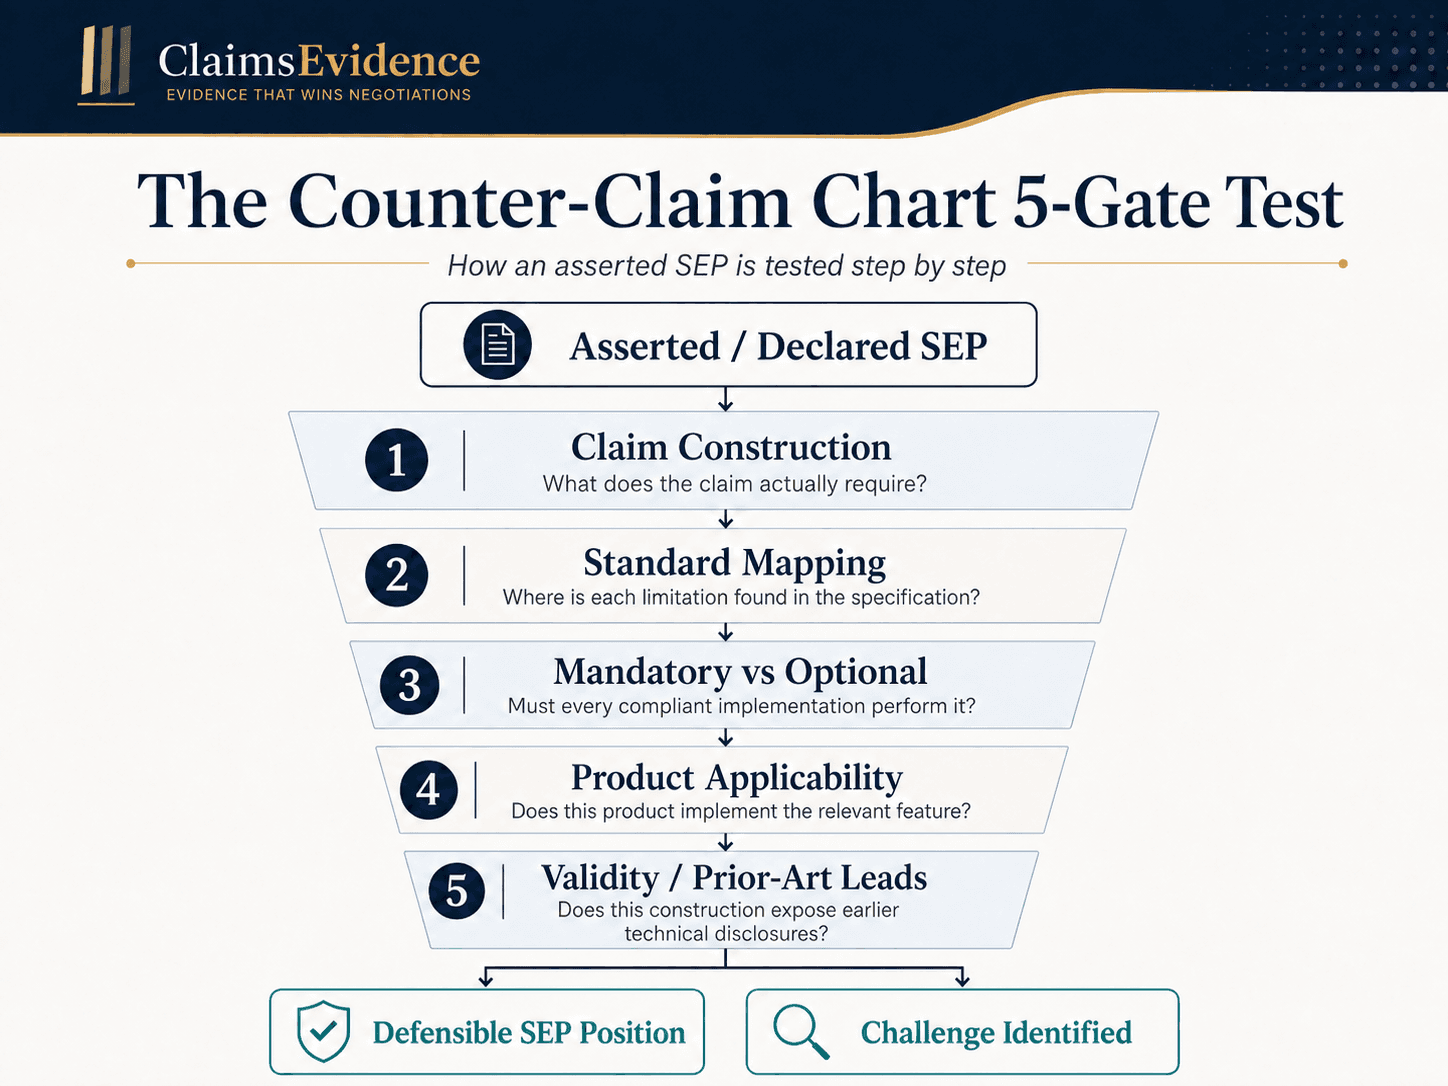
Gate 1 — Claim construction
Define each relevant limitation using the claim language, patent description and, where material, prosecution record. Record ambiguity rather than hiding it.
Gate 2 — Standard mapping
Pinpoint the normative passage said to satisfy each limitation. Functional similarity is not enough; the cited mechanism must perform the claimed structure or act.
Gate 3 — Mandatory versus optional
Test whether the mapped feature is required, conditional or one of several permitted alternatives. Check the modal language, dependencies, profiles and release-specific conditions.
Gate 4 — Product applicability
Determine whether the relevant device, network component, encoder, decoder or module performs the mapped behavior. Standard capability is not the same as product use.
Gate 5 — Validity and prior-art leads
Test whether the proposed construction exposes earlier patents, standard drafts, technical contributions or publications. This is best labeled as companion validity analysis, not treated as proof of non-essentiality.
How much analysis is economically rational?
Counter-Claim Charting does not mean “analyze everything.” The rational depth depends on the licensing exposure, the cost of review, the expected number and value of successful challenges, and the time horizon over which the position matters.
Illustrative model only. The examples below assume equal weighting among essential patent families and a linear relationship between portfolio share and royalty allocation. They are not FRAND valuations, legal opinions or predictions of negotiation outcomes.
| Scenario | Licensor exposure | Value per portfolio unit | Proportionate response |
|---|---|---|---|
| High-volume smartphone | 150M coins/year | 300K coins/year | Deep portfolio review can be rational |
| Low-exposure IoT | 20K coins/year | 40 coins/year | Screen and review representative patents |
| Mid-sized connected device | 1M coins/year | 2K coins/year | Portfolio triage; deepen over a multi-year horizon |
Example 1 — High-volume smartphone manufacturer
Start with a manufacturer selling 150 million devices each year. Under the deliberately simplified assumptions below, the licensor holds 2.5% of the modeled essential units.
| Input | Hypothetical value |
|---|---|
| Device price | 500 coins |
| Annual units | 150M |
| Aggregate royalty burden | 8% |
| Total essential units in model | 20,000 |
| Licensor portfolio | 500 units |
| Licensor portfolio share | 2.5% |
The aggregate burden is 500 × 8% = 40 coins per device. The licensor's modeled 2.5% share is therefore 1 coin per device, or 150M coins per year across the annual sales volume.
If the licensor's 500 units are weighted equally, one portfolio unit represents 1 / 500 = 0.002 coins per device. Across 150 million devices, changing the treatment of one unit changes the modeled annual position by approximately 300K coins.
Detailed review: 500 units × 5K = 2.5M coins
One-year break-even: 2.5M / 300K = 8.3 units, so approximately nine successful exclusions
Lower-cost review: at 1K per unit, the portfolio costs 500K to review; two successful exclusions yield 600K in modeled first-year value—a 20% return on the analysis expenditure
At this level of exposure, deep Counter-Claim Charting can be economically rational even if only a small fraction of the asserted portfolio is successfully challenged. The value can also persist beyond the first year if the same licensing position applies to later sales.
Example 2 — Low-exposure IoT manufacturer
Now take a business with much lower unit volume and revenue. The same portfolio share produces a very different answer about how much analysis is proportionate.
| Input | Hypothetical value |
|---|---|
| Device price | 80 coins |
| Annual units | 200K |
| Annual product revenue | 16M coins |
| Aggregate royalty burden | 5% |
| Aggregate royalty stack | 800K coins |
| Licensor portfolio share | 2.5% |
The modeled annual royalty to the licensor is 800K × 2.5% = 20K coins. Across a 500-unit portfolio, each equally weighted unit represents only 20K / 500 = 40 coins per year.
Even automated triage priced at 100 coins per asserted unit would cost 500 × 100 = 50K coins. That is more than twice the implementer's entire modeled annual exposure to the licensor. A 50K review therefore cannot produce a first-year return through royalty reduction alone—even if the analysis removed the full 20K modeled royalty.
A proportionate response might instead combine:
- inexpensive automated portfolio triage;
- review of the highest-risk representative patents;
- product-applicability and legal-status screening; and
- deeper Counter-Claim Charts only if the negotiation or litigation risk escalates.
Counter-Claim Charting is therefore not synonymous with analyzing everything. It is also a mechanism for deciding where not to spend defensive resources.
Example 3 — Mid-sized connected-device business
Increasing annual volume changes the calculation again, even with the same device price, aggregate burden and licensor portfolio share.
| Input | Hypothetical value |
|---|---|
| Device price | 80 coins |
| Annual units | 10M |
| Annual product revenue | 800M coins |
| Aggregate royalty burden | 5% |
| Aggregate royalty stack | 40M coins |
| Licensor portfolio share | 2.5% |
Here the licensor's modeled annual royalty becomes 40M × 2.5% = 1M coins. Across 500 equally weighted units, each unit represents 1M / 500 = 2K coins per year.
If portfolio triage costs 50K, first-year break-even requires 50K / 2K = 25 successful exclusions—only 5% of the asserted portfolio. Portfolio-wide triage begins to make substantially more sense at this exposure level.
A deeper 500K review would require 250 successful exclusions to break even in one year. But the position changes over a longer horizon. Over three years, ignoring discounting and changes in sales volume, break-even is 500K / (2K × 3) ≈ 84 units, or approximately 17% of the portfolio.
The useful question is not simply “What does a claim chart cost?” It is: What is the expected value of changing the licensing position it supports?AI-assisted review can reduce the cost of the first pass, but expert verification, prioritization and escalation remain necessary where the result will influence a license, settlement or court position.
From a claim chart to an evidence stack
A Counter-Claim Chart is one layer in a mature implementer defense process. Each subsequent layer answers a different commercial or legal question:
- Licensor claim chart: what is being asserted?
- Counter-Claim Chart: does the mapping hold?
- Product applicability: does the product use the relevant feature?
- Prior art and validity: will the asserted claim survive?
- Portfolio assessment: how strong is the asserted portfolio overall?
- Economic / FRAND model: what position should be taken in negotiation?
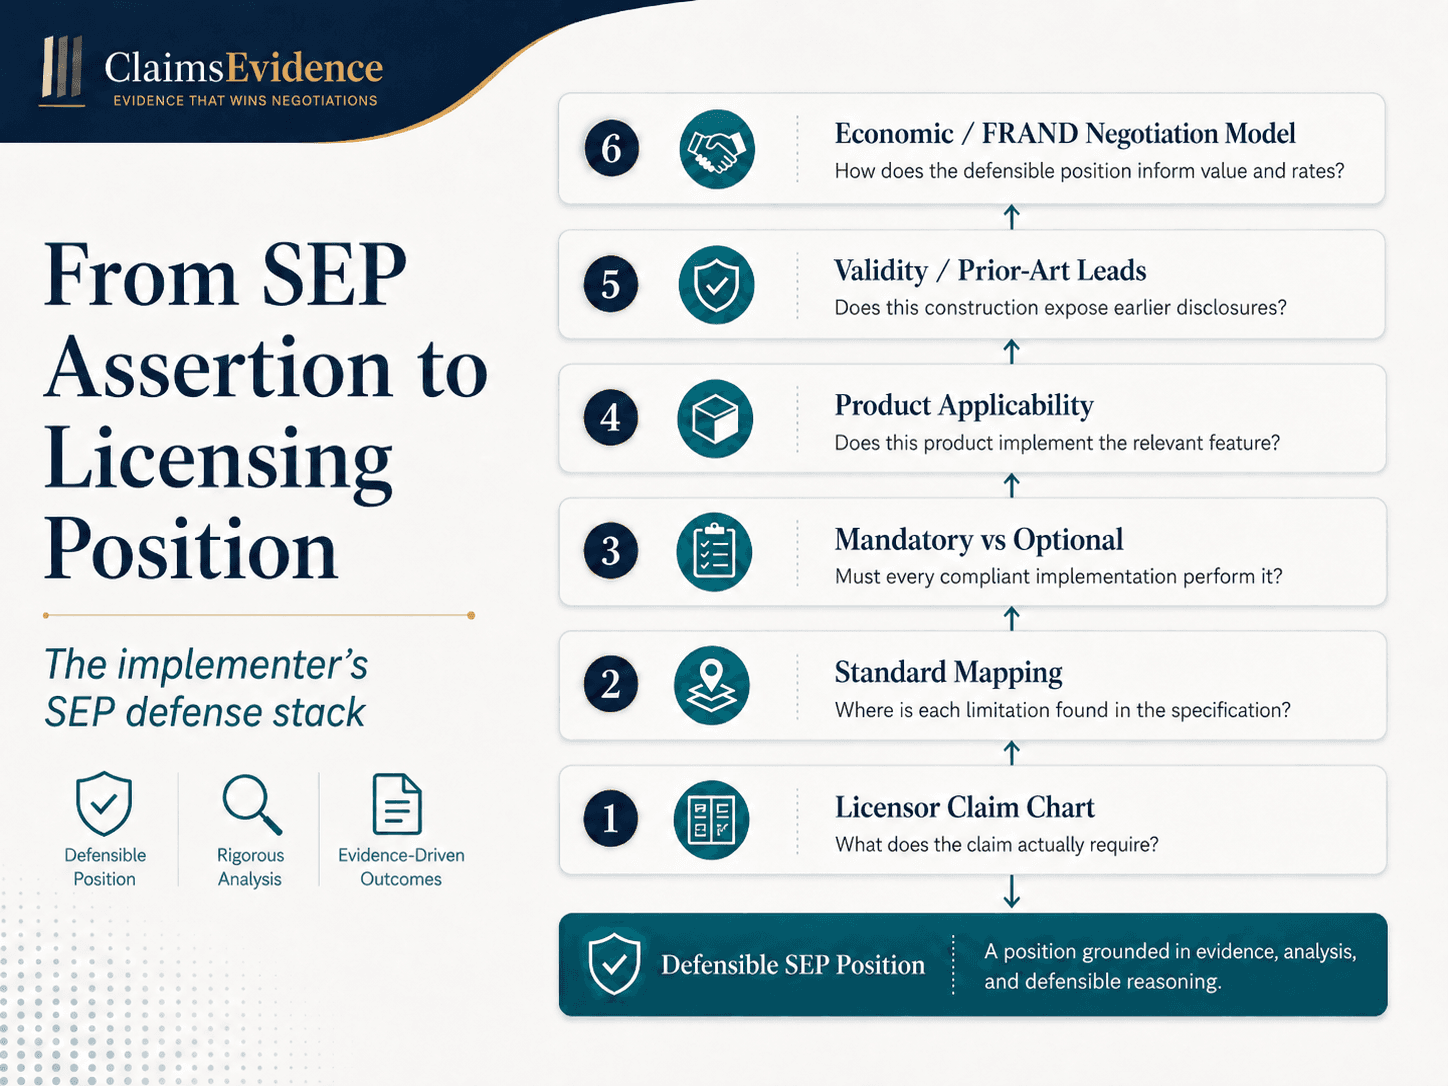
Together, these layers replace a binary exchange—“these are our SEPs; here is the royalty”—with a more useful discussion: which patents are relevant, under which construction, to which standardized feature, in which products, and with what evidentiary and economic weight?
The working definition
A Counter-Claim Chart is an implementer-side, limitation-by-limitation analysis prepared in response to an asserted patent or SEP claim chart. It independently tests claim construction, the cited standard passages, mandatory versus optional behavior and product applicability, and may be supplemented by validity, prior-art, legal-status and licensing analysis.
As analysis becomes less expensive, Counter-Claim Charting can become a routine part of SEP licensing rather than an exceptional litigation expense. The important change is not producing more charts. It is making the evidence behind a demand testable early enough to affect the negotiation.
Frequently asked questions
What is a Counter-Claim Chart?
A Counter-Claim Chart is an implementer-side, limitation-by-limitation analysis prepared in response to an asserted patent or SEP claim chart. It independently tests claim construction, the cited standard passages, mandatory versus optional behavior and product applicability, and may be supplemented by validity, prior-art, legal-status and licensing analysis.
Is a Counter-Claim Chart the same as a validity analysis?
No. Essentiality asks whether a compliant implementation necessarily practices every limitation of a patent claim. Validity asks whether that claim should have been granted and remains enforceable. The analyses interact through claim construction, but they answer different questions and should remain separately identified.
Why does mandatory versus optional behavior matter?
A mapping to an optional, conditional or alternative standard mechanism may not establish that every relevant compliant implementation practices the claimed feature. The chart therefore tests the normative language, conditions, actors, release and permitted alternatives rather than relying on functional similarity alone.
Does an ETSI declaration prove that a patent is essential?
No. ETSI describes its database as covering patents declared essential or potentially essential, and its current SR 000 314 states that ETSI has not investigated the essentiality or validity of the listed rights. A declaration is important notice and licensing information, but it is not an independent technical determination for a particular patent, claim, standard release or product.
Related ClaimsEvidence analysis
From Claim Chart to Counter-Argument
The working process for defensive essentiality analysis under negotiation timelines.
Read the practice noteProduct-Specific SEP Landscaping
Why standard capability and the accused product’s actual implementation must be separated.
Read the practice noteLTE Categories as a First Gate
How device capability classification can narrow an asserted LTE portfolio early.
Read the practice noteFrom SEP Demand Letter to Defensible Position
How charting, product evidence, validity work and negotiation strategy fit together.
Read the practice noteSources
- ETSI, Intellectual Property Rights (IPRs)— ETSI's overview of the IPR policy and database.
- ETSI SR 000 314 V2.39.1 (2026-03)— notified essential or potentially essential IPRs, ETSI's no-investigation notice, and the policy definition of essential.
- ETSI IPR Online Database— declaration search and database disclaimer.
- ETSI TS 136 321 V18.3.0 / 3GPP TS 36.321 Release 18— LTE MAC protocol specification, including contention resolution.
Get our practice notes and deep-dive reports first
We publish deep technical analyses on SEP essentiality, FRAND evidence, and patent-licensing risk — with purpose. Subscribe to get each one when it lands.
No spam. Unsubscribe any time.
Test the mapping before you price the demand.
ClaimsEvidence prepares fixed-cost, expert-reviewed essentiality, product-applicability and invalidity evidence for implementers and their counsel.
Discuss a claim chartAbout the authors

Christoph Hewel
ClaimsEvidence Co-Founder & CPO · Patent Attorney & UPC Representative
Christoph Hewel is a patent attorney and UPC representative with extensive experience in SEP litigation. He is Co-Founder / CPO of ClaimsEvidence and has represented clients in major patent cases, including Huawei v. Unwired Planet, Microsoft v. SIA, and Wiko / Google / Asus / HTC v. Philips, among others.
View LinkedIn profile
Konstantinos Poulinakis
ClaimsEvidence Co-Founder & CEO · AI expert
Konstantinos Poulinakis is the Co-Founder & CEO of ClaimsEvidence. He has 7+ years of experience architecting and leading AI solutions, for the highly-regulated, high-stakes industries of legal and finance. Former Senior AI engineer at Deutsche Bank and Aleph Alpha, the German frontier AI lab.
View LinkedIn profile